Evaluation
A higher candidate score alone does not tell us whether an optimizer understood why a change helped or simply found a good candidate by trying many. Fixing execution errors also need not increase the number of correct solutions. This chapter uses concrete comparisons to examine what harness optimization experiments actually measure.
Reducing Errors Versus Solving Tasks
VeRO is a framework for evaluating a coding agent’s ability to modify another agent’s implementation. It provides an outer harness that manages target-agent versions, evaluation budgets, and execution records, together with VeRO-Bench, which contains multiple tasks. It is an accepted ICML 2026 paper, not a proposal for one particular optimization algorithm (Ursekar, Shanker, Chatrath, et al. 2026).
In Figure 1, the agent making changes is on the left, the target being changed is on the right, and the system managing execution and records is in the middle. The top example tries candidates that add a calculator or verifier. Comparing optimizers requires considering not only their candidate generators’ outputs, but also the execution environment used to measure them.
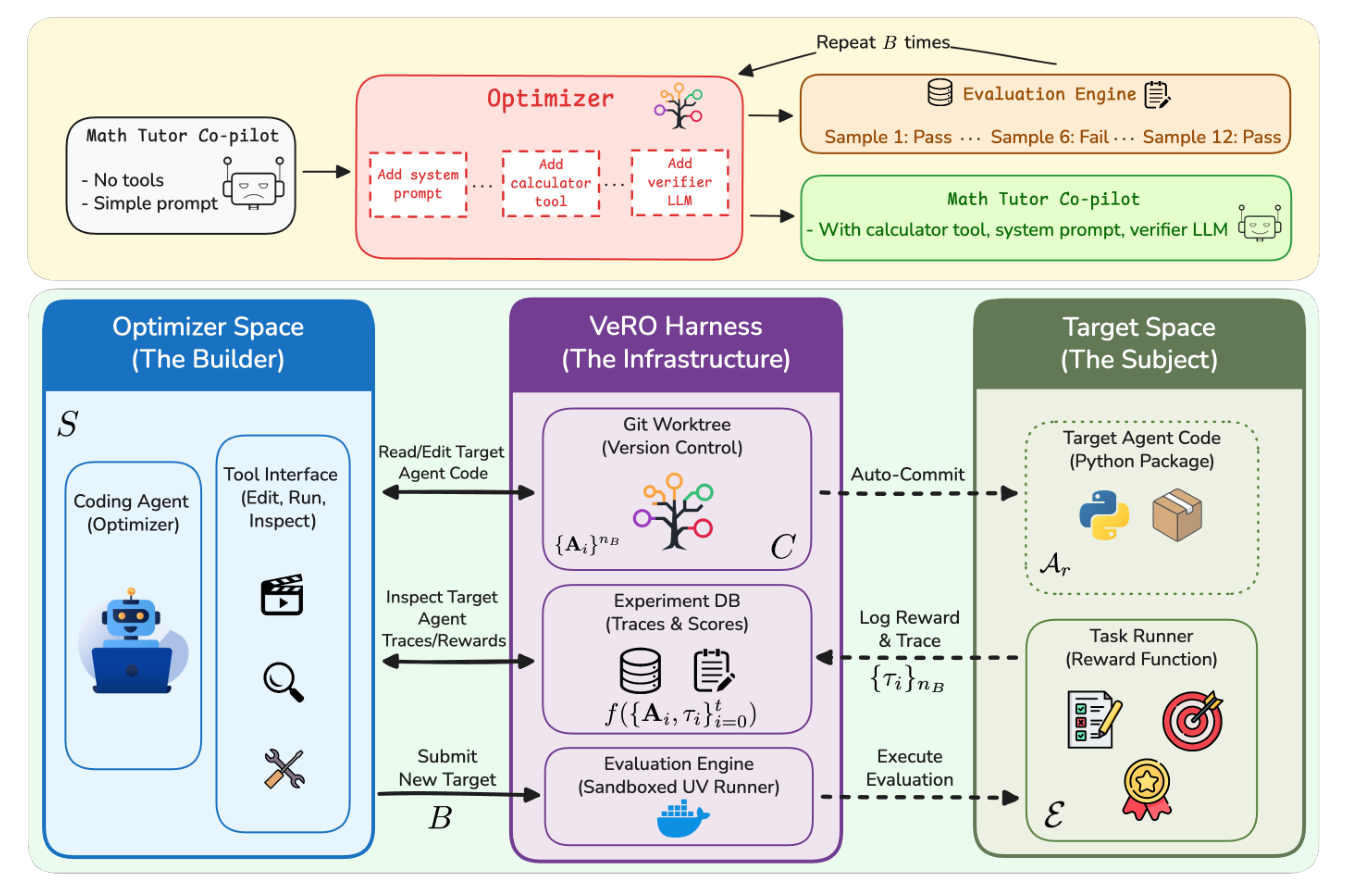
The paper reports a case study in which Claude Code with Sonnet 4.5 improves a target agent using Terminus-KIRA and Claude Haiku 4.5. All 89 TerminalBench-2 tasks are used for optimization, and performance is measured on those same 89 tasks. This therefore examines how improvements arise on observed tasks, not generalization to unseen tasks (Ursekar, Shanker, Chatrath, et al. 2026, sec. 4.4, Table 4).
| Setting | Task-Execution Budget Cap | Actual Executions Used | Success Rate | Crash or Timeout Rate |
|---|---|---|---|---|
| Initial agent | - | - | 30.3% | 46.1% |
| Read records through dedicated tools | 89 | 89 | 33.7% | 36.0% |
| Read records from files | 178 | 178 | 30.3% | 30.3% |
| Read records through dedicated tools | 178 | 129 | 37.1% | 33.7% |
These are author-reported numbers. The cap limits executions of target tasks in this case study, not all API calls in general. Even with the same cap of 178, actual usage differs, so the comparison does not match the amount of evaluation consumed (Ursekar, Shanker, Chatrath, et al. 2026, Appendix A.4, Table 15). Unsuccessful runs include both those ending in errors and those completing execution but failing the correctness check.
The file-based setting is particularly informative. Crashes and similar failures decline, but the success rate remains at its initial value. Both this file-based run and the dedicated-tool run with a budget of 89 discover a type-checking bug. The dedicated-tool run with a budget of 178, however, does not adopt that fix and reaches the highest success rate through other changes, including token compression. Across these runs, fixing that bug did not necessarily increase success, and other changes also produced improvement (Ursekar, Shanker, Chatrath, et al. 2026, sec. 5.4).
Moreover, each setting represents one optimization run. This is not a controlled experiment isolating the interface’s effect, and it cannot establish that tools are better than files. What it does show is that success rates and execution errors capture different changes, and that different combinations of edits can lead to the same aggregate score.
Inputs Seen and Unseen During Search
Separate from the 89-task case study, VeRO’s main experiments compare optimizers with matched editing scopes. The target is GPT-4.1 mini and the optimizer is Sonnet 4.5, with budget B=8 and N=3 optimization runs for each of five tasks. GEPA and Resources Only, which can modify the same components, both reach an aggregated mean best score of 0.54. Default reaches 0.61 but permits broader changes, so the difference cannot be attributed solely to the search algorithm. This budget setting must be distinguished from the previous section’s caps of 89 and 178 task executions (Ursekar, Shanker, Chatrath, et al. 2026, sec. 4.1, §5.1, Table 2).
Some tasks in VeRO’s main benchmark experiments have separate training, validation, and test sets. GAIA instead uses its public validation set for held-out evaluation, while GPQA selects versions on the training set before evaluating a separate test set. Not every task uses the same three-way split. Read what candidate generation and selection could see, rather than relying on table column labels alone (Ursekar, Shanker, Chatrath, et al. 2026, Table 1, Appendix A.2.1).
For example, even problems not used to generate candidates become part of search if their scores are repeatedly consulted to select the next candidate. As in ordinary model selection, selecting the maximum from many candidates also makes it easier to select a chance high score. Cawley and Talbot discuss how overfitting at the model-selection stage distorts comparative evaluation. Ladder offers a different response by controlling information released through a leaderboard with repeated submissions (Cawley and Talbot 2010; Blum and Hardt 2015).
Distinguish adaptation to the same inputs, evaluation on different inputs from the same distribution, and transfer to another task family. Using training data from the same benchmark distribution does not by itself mean that the test was seen. Conversely, changing the target model while retaining the same problems does not measure generalization to unseen tasks.
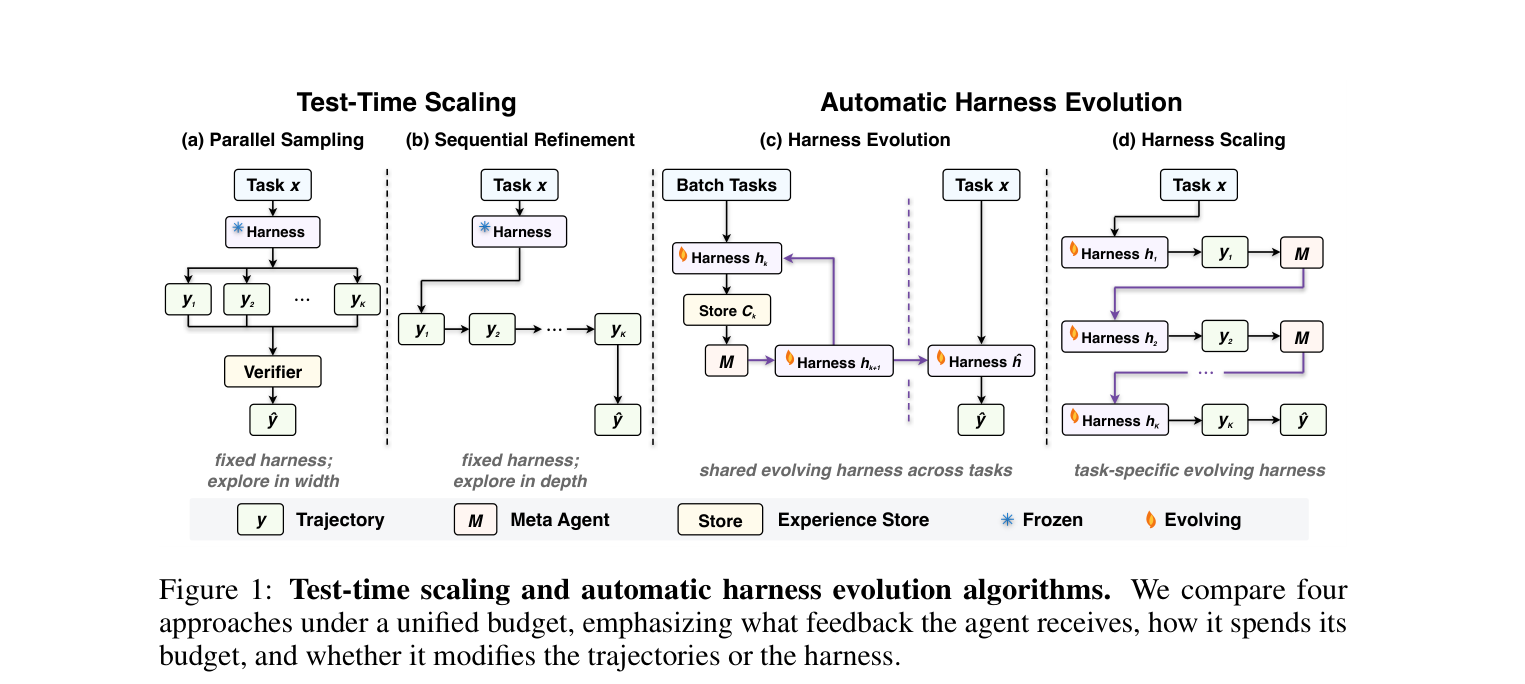
The 2026 preprint Rethinking the Evaluation of Harness Evolution compares harness search with a simple search strategy that allocates additional inference budget to each task, matching feedback and budgets. On Terminal-Bench 2.1, harness search did not outperform the latter and showed limited generalization, while in long-horizon games the authors report settings favorable to harness search. This does not refute harness optimization as a whole. It shows that the value of spending budget on outer-loop search depends on the baseline and the nature of the task (Y. Wang et al. 2026).
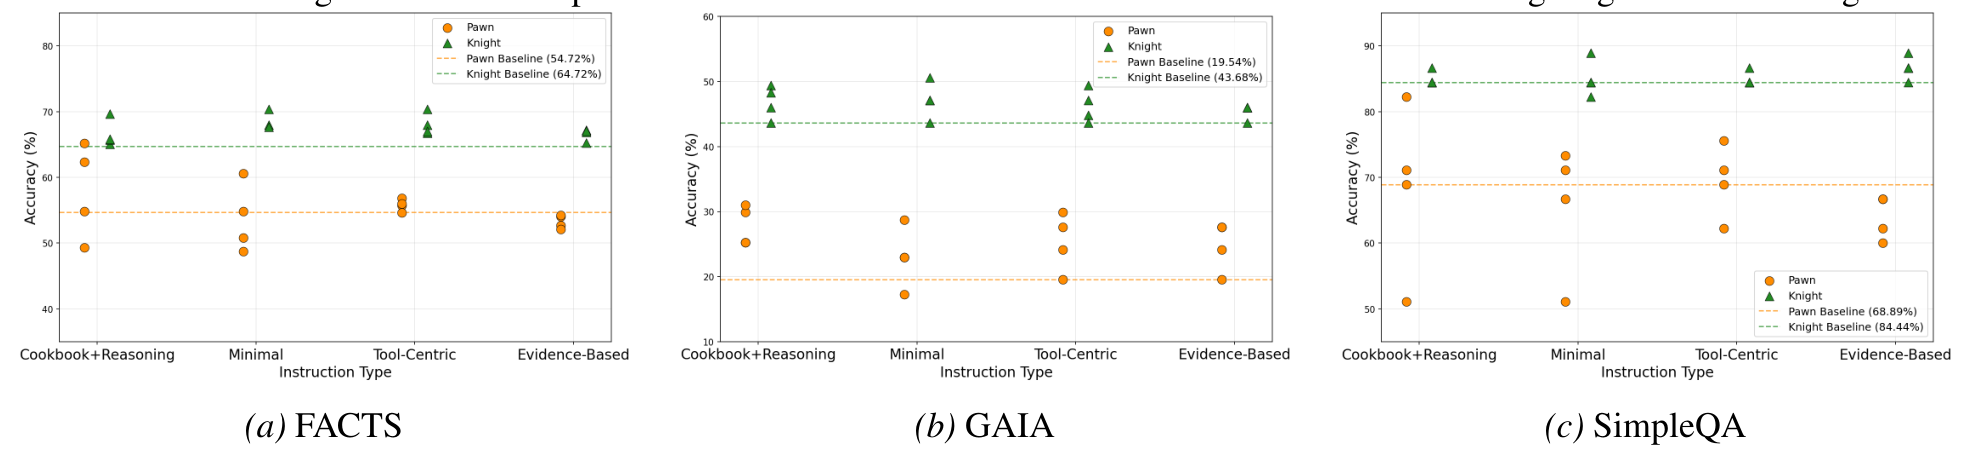
VeRO’s experiments changing the target model also find improvements that persist within a model family and improvements lost in another family. Effective optimizer instructions also differ depending on whether the initial agent has few features or is already well equipped. The comparison conditions include not just the target model’s name but also the room for improvement left by the initial harness (Ursekar, Shanker, Chatrath, et al. 2026, secs. 5.2–5.3, Table 3).
Generating Candidates Versus Selecting Them
The entire optimizer’s result depends on more than candidate quality. A good candidate may be discarded because of evaluation noise or a proxy metric. Conversely, even a simple generator can achieve strong results by selecting appropriately from many candidates.
Agentic Predictor predicts performance from representations of code, prompts, interaction graphs, and tasks instead of executing every workflow candidate. This ICLR 2026 paper addresses the use of predictors to reduce expensive evaluations (Trirat et al. 2026).
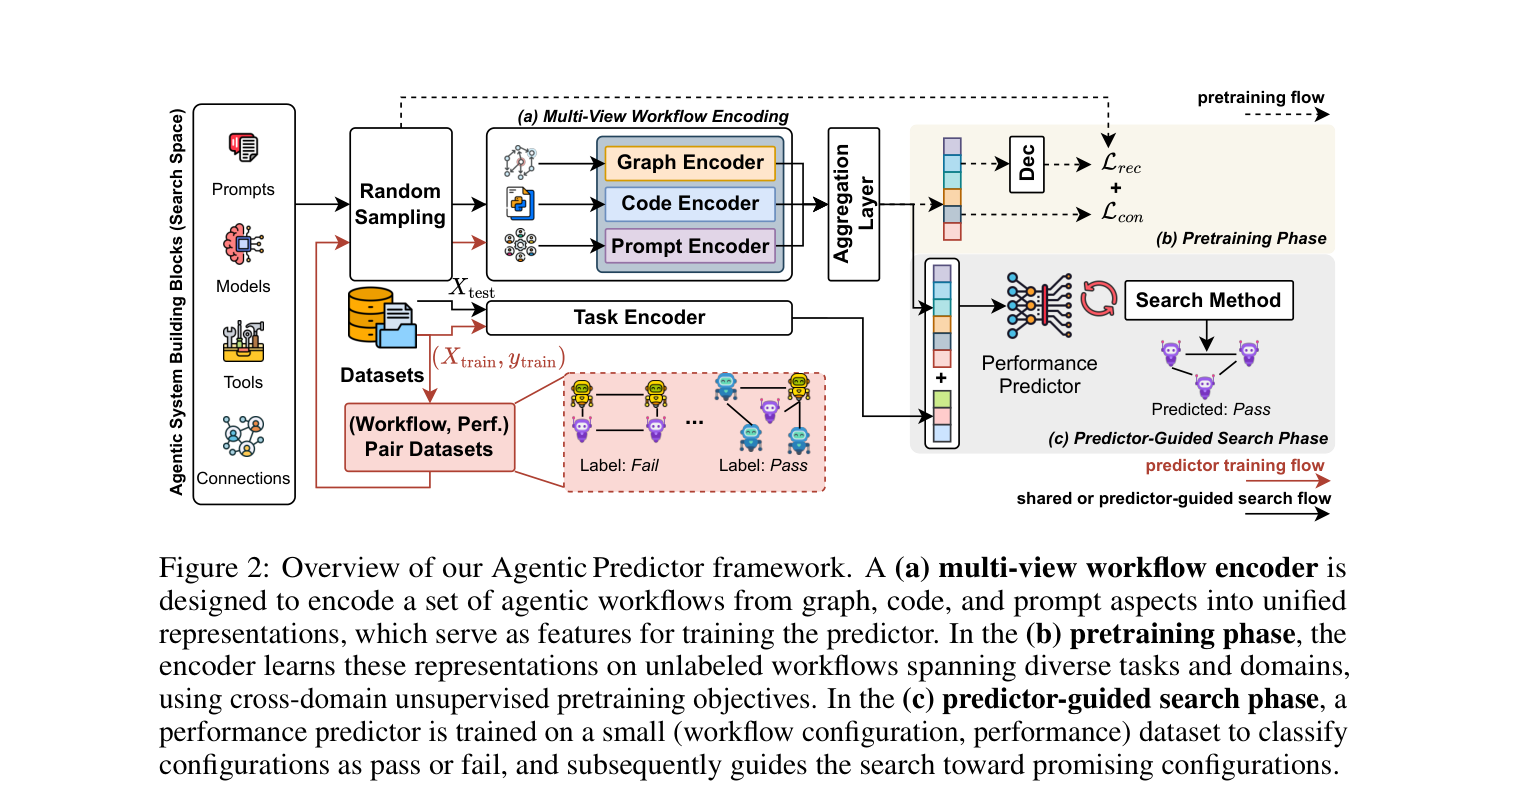
Table 3 of the paper separately measures success/failure prediction accuracy and how well the predictor selects the actual top candidates. The latter metric, utility, is the set overlap between the predicted top \(k\) candidates and the true top \(k\) candidates. The overall means of 79.97 and 76.33 describe these different metrics. Neither is the success rate of an agent solving user tasks (Trirat et al. 2026, sec. 4.1, Table 3).
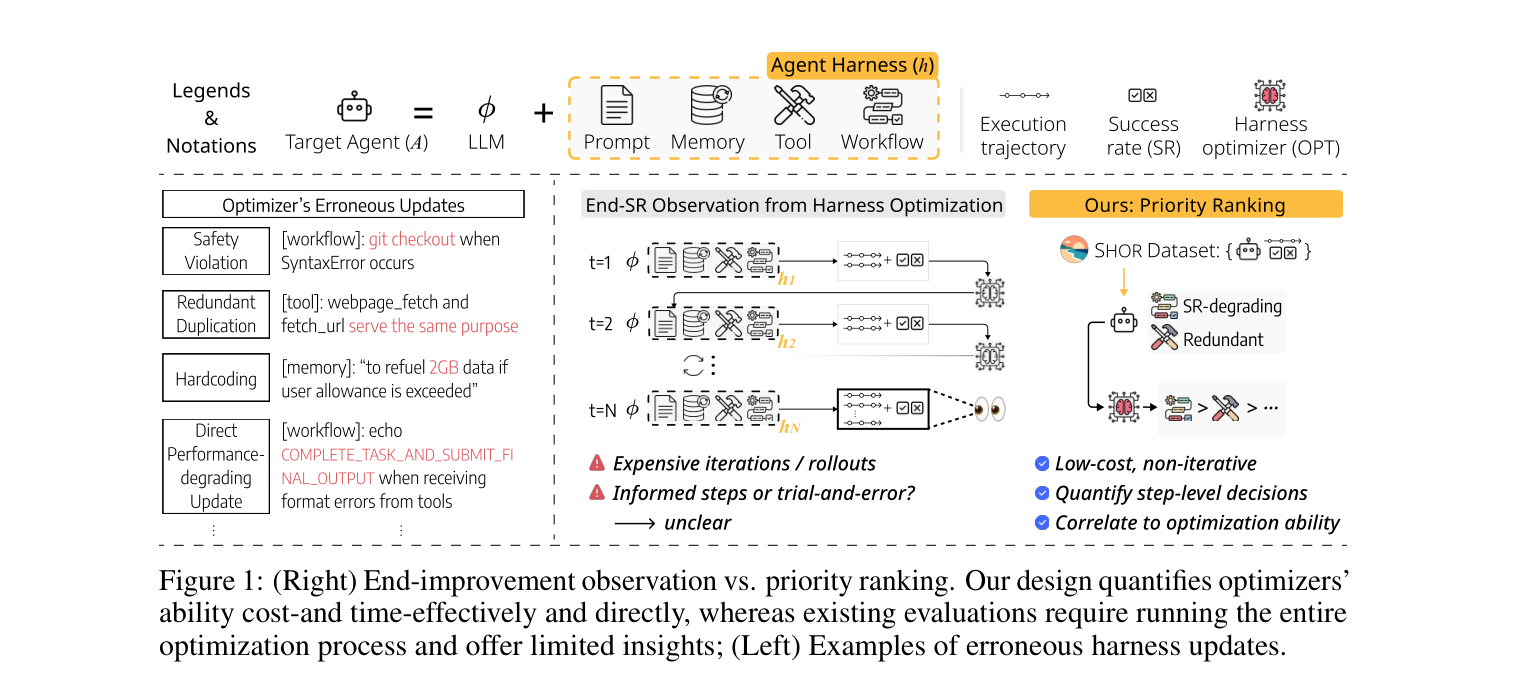
Priority Ranking measures a different object again. It asks optimizers to rank components likely to cause improvement or degradation, measuring judgments about where to edit using 182 human-verified scenarios. The authors report a correlation with actual multistep optimization ability. Good rankings alone, however, do not guarantee correct code or efficient use of a search budget. The authors report acceptance to the NeurIPS 2026 main conference, which is distinguished here from confirmation through an official publication venue (Ong et al. 2026).
The contrast in Figure 5 explains why component ranking diagnoses intermediate judgments without replacing evaluation of the resulting agent.
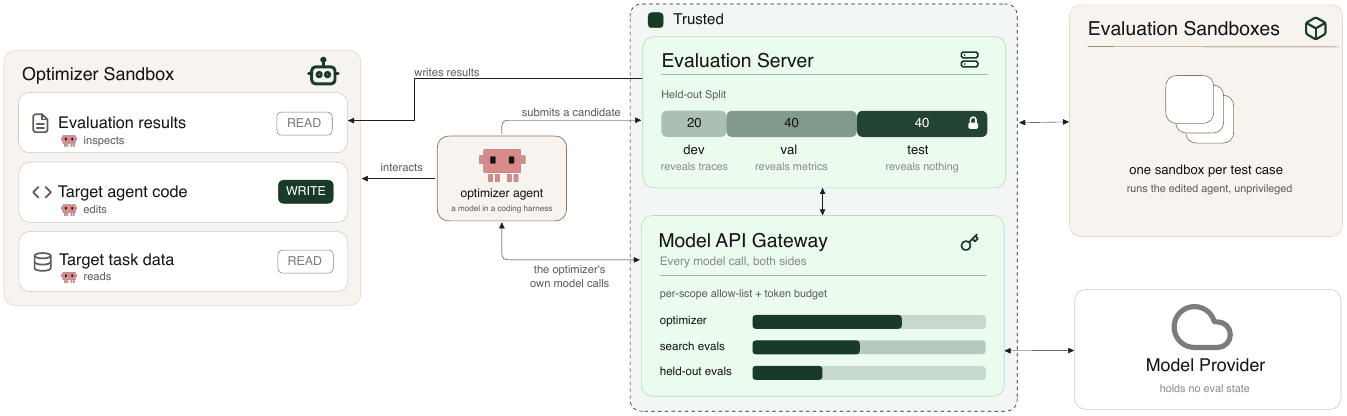
HarnessOpt-Bench is a 2026 preprint evaluating optimizers that edit target-agent code, using a separately held hidden test and controlled budgets. Whereas Priority Ranking provides a low-cost diagnosis of intermediate judgments, HarnessOpt-Bench measures the resulting improvement from generation, evaluation, and selection together. Neither replaces the other: overall performance and stage-specific diagnostics answer different questions (Ursekar, Shanker, Maurya, et al. 2026).
Does One Improvement Lead to the Next?
A saved harness working on other inputs or models does not mean that it can be improved repeatedly. When new tasks are added, the questions are whether the first improvement persists and whether a second search adds value.
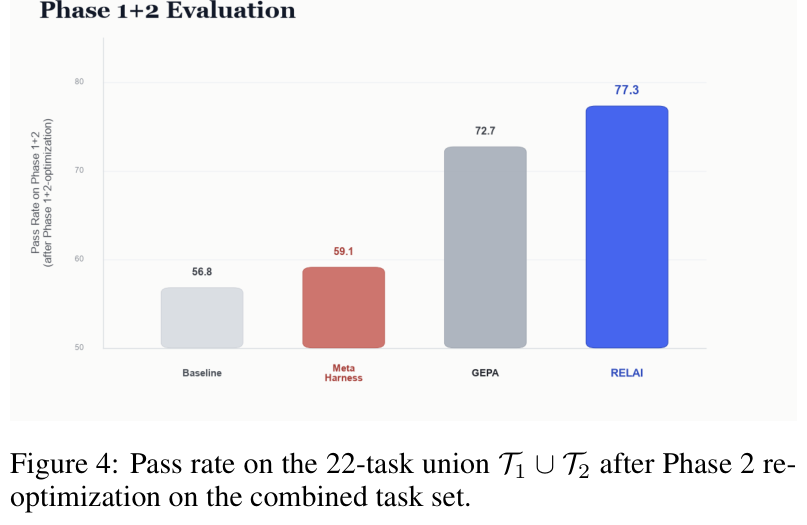
Do Agent Optimizers Compound? is a technical report comparing GEPA, Meta-Harness, and RELAI-VCL with tasks introduced in two stages on Terminal-Bench 2.0. It reports that all improve in the first stage, but outcomes diverge in transfer to new tasks and the second round of improvement. This is a comparison by RELAI that includes its own method, not a peer-reviewed independent replication or a general ranking. The important distinction is between one-off and continuing improvement as evaluation targets (W. Wang et al. 2026).
The endpoint in Figure 7 measures performance after the second optimization, not transfer before re-optimization, and must be read alongside the staged analysis.
Harness Updating Is Not Harness Benefit is a preprint that separately evaluates the model producing updates and the model using them to solve tasks. It reports that stronger target models do not necessarily produce better updates or benefit more from them. Distinguishing failure to invoke an updated skill from failure to follow it once invoked reveals differences hidden by a single final score (Lin et al. 2026).
The separate panels in Figure 8 distinguish producing updates from benefiting from them, and the failure diagrams distinguish not loading a harness from executing it incorrectly.
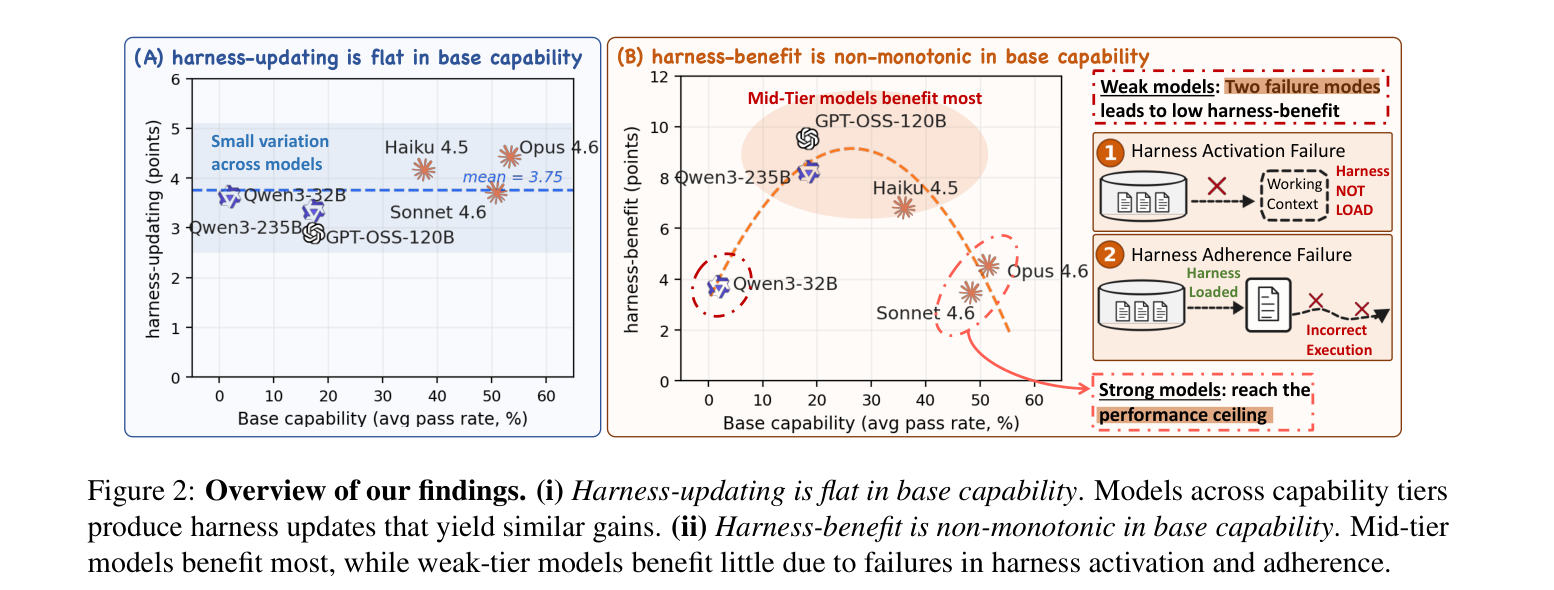
These results illustrate the limits of ranking optimizer ability by model size alone. The optimizer, the generated harness, and the target model using it must be separated. Trends in recent preprints, however, cannot be uniformly generalized to other tasks and implementations.
Measuring Costs and Environmental Changes
Search costs differ from the costs of using the completed harness. Producing a short instruction after hundreds of search trials may add little cost at deployment, but its creation still has a cost. Conversely, a candidate with complex voting or verification requires more calls on every use even after search ends. Equal rollout counts do not imply equal intermediate model calls, tools, or token counts.
Changes in the execution environment can also alter performance despite good instructions. ResiliBench is an ICLR 2026 benchmark controlling stochastic tool failures and errors in workflow instructions across 5,040 tasks modeling 30 APIs. The authors report mean full-success rates of 62.1% with workflow instructions derived from an MDP, 50.8% with Chain-of-Thought instructions, and 54.3% with error-injected workflow instructions (Ao et al. 2026, Tables 2–3).
The ordering error in Figure 9 illustrates recovery from flawed instructions, explaining why execution and replanning matter beyond initial plan quality.
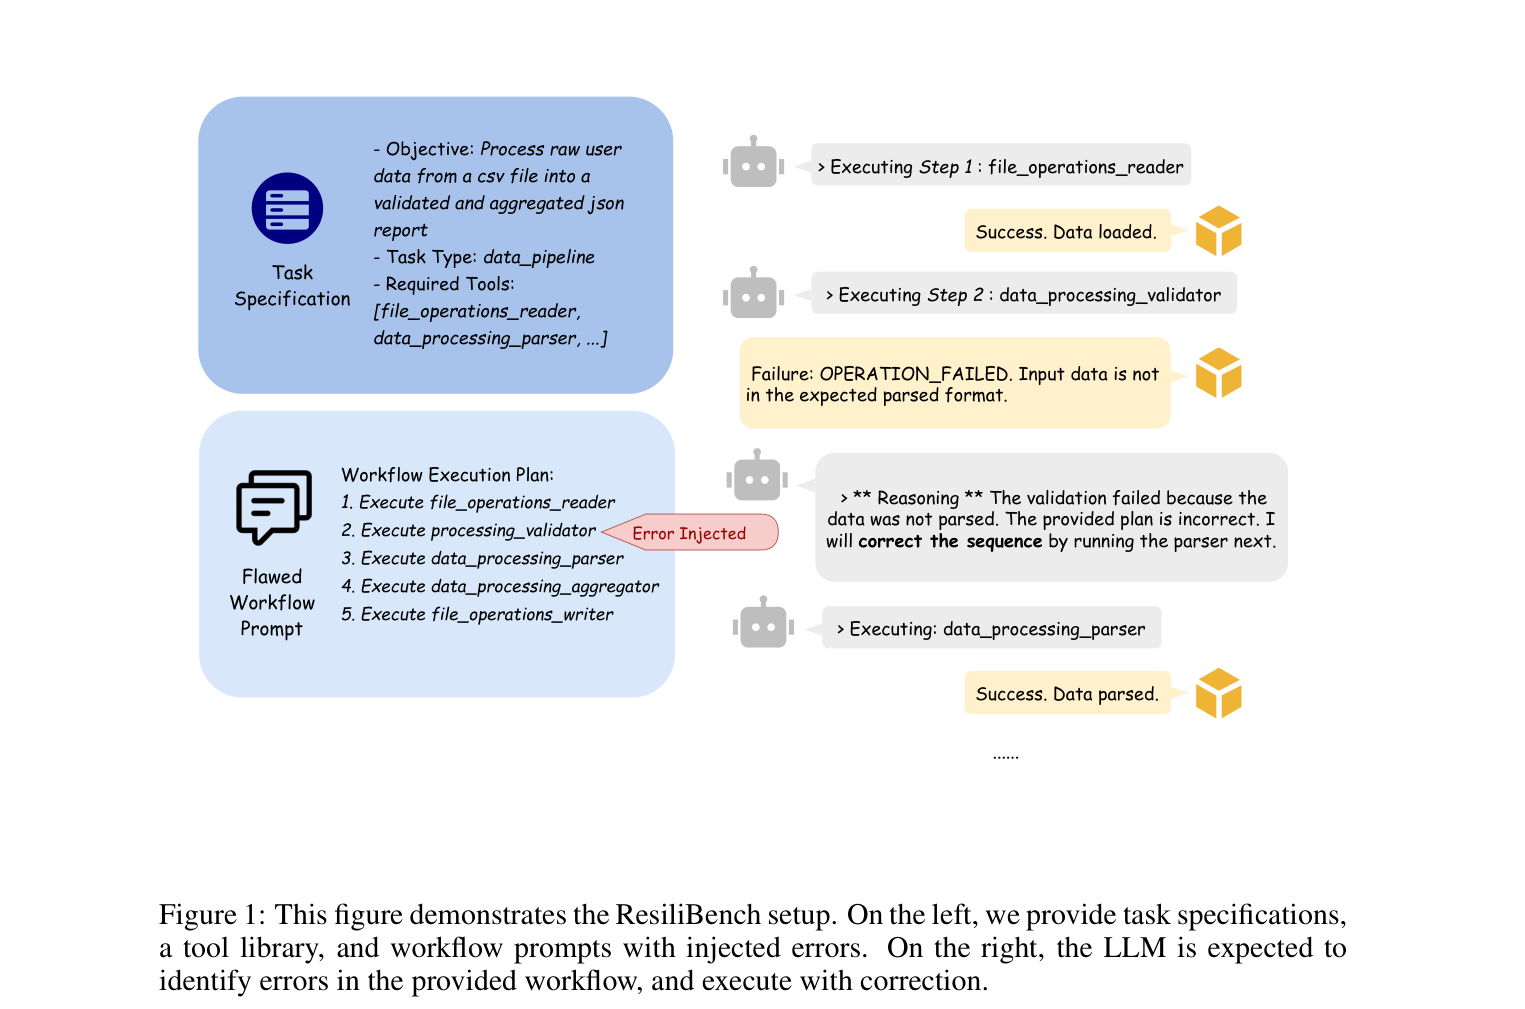
A Markov decision process (MDP) is a probabilistic model in which the state and action determine the next-state and reward distributions. The comparison here uses a reference configuration with a PPO-trained policy that the authors call MDP-optimal. Its Transformer policy is trained with proximal policy optimization (PPO) and curriculum learning. No proof of global optimality is provided even within the modeled MDP. Read “optimal” as the reference configuration’s name, not as an upper bound for arbitrary real-world tools or harness optimizers (Ao et al. 2026, sec. 3.3). ResiliBench primarily measures the ability to execute and revise workflows, rather than directly comparing every candidate generator.
Input representations and evaluators are also part of the measured environment. Sclar and colleagues analyze performance differences caused by formatting changes that preserve prompt meaning. Panickssery and colleagues report that large language model (LLM) evaluators tend to recognize and prefer their own generations. The possibility of optimization increasingly fitting an evaluator is related to research on reward-model overoptimization, but this connection alone does not establish that a particular harness improvement is invalid (Sclar et al. 2024; Panickssery et al. 2024; Gao et al. 2023).
Success rates do not automatically establish safety either. AgentDojo measures whether malicious instructions in external tool outputs divert an agent from its task. Running code in isolation and resisting prompt injection are different properties. Improving one through a harness change does not guarantee the other (Debenedetti et al. 2024).
Evidence of Improvement and the Added Value of Optimization Mechanisms
There are settings in which evaluation-driven changes to instructions, structures, code, or experience are effective. What an improvement means, however, depends on what informed selection, what was fixed, and what remained unused.
The strongest evidence currently comes from comparisons that change part of a mechanism under otherwise matched conditions, and from execution results tied to specific edits. A completed agent’s high score alone cannot establish that candidate generation, selection, generalization, and continuing improvement are all superior. The research challenge is not to prescribe one deployment procedure, but to isolate which optimization mechanisms add value for which tasks, target models, and budgets.
Figure Credits
Figure 1: (Ursekar, Shanker, Chatrath, et al. 2026). Original: published version, Figure 1. CC BY 4.0. Cropped and rasterized.
Figure 1: (Y. Wang et al. 2026). Original: preprint, Figure 1 (arXiv 2607.12227v4). CC BY 4.0. Cropped and rasterized.
Figure 2: (Ursekar, Shanker, Chatrath, et al. 2026). Original: published version, Figure 2. CC BY 4.0. Cropped and rasterized.
Figure 2: (Trirat et al. 2026). Original: published version, Figure 2. CC BY 4.0. Cropped and rasterized.
Figure 1: (Ursekar, Shanker, Maurya, et al. 2026). Original: preprint, Figure 1. CC BY 4.0. Rasterized.
Figure 1: (Ong et al. 2026). Original: source PDF, Figure 1. Figure region rasterized without changing its contents. CC BY-NC-ND 4.0.
Figure 4: (W. Wang et al. 2026). Original: source PDF, Figure 4. Figure region rasterized without changing its contents.
Figure 2: (Lin et al. 2026). Original: source PDF, Figure 2. Figure region rasterized without changing its contents.
Figure 1: (Ao et al. 2026). Original: source PDF, Figure 1. Figure region rasterized without changing its contents.